Gnuplot
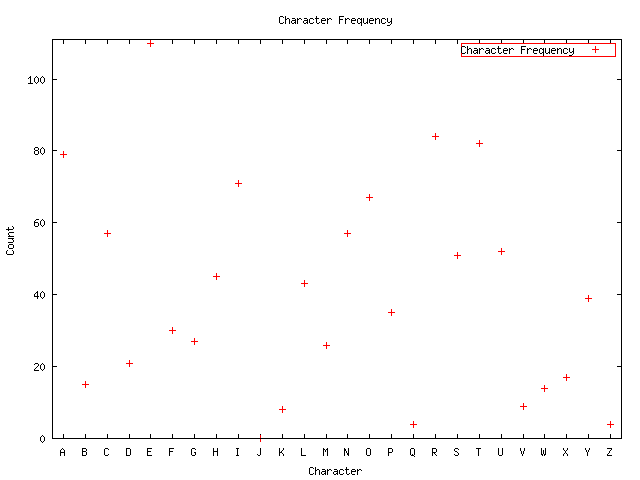
Some years ago, when I had to create plots from measurement data for a student research project I first started using Gnuplot. Although several powerful alternatives exist, I never felt the need to switch away from Gnuplot and I'm still using it for all my plotting tasks. In almost all cases, these tasks consist of visualizing data that was acquired with the help of other tools, such as Iperf. Sometimes this data is not suitable to be feed directly into Gnuplot, but requires some preprocessing first. So my usual approach was to write a Bash or Perl script to preprocess and sanitize the collected data and then dynamically generate a Gnuplot script for this specific data set. Depending on data, however, this felt like a cumbersome and suboptimal approach. The two scripts res.pl and wrapper.sh illustrate this point. The Perl script is called by the bash script and transforms the input data into a whitespace seperated data set. The bash script then extracts several additional information, e.g. the axis labels. Then, a Gnuplot script is generated and executed to finally create the plot. Although this works, a more elegant way would have been the utilization of a gnuplot library, such as Chart::Graph::Gnuplot. I've written the small demo script frequency.pl to illustrate the usage of the aforementioned library. The script counts the character frequency of an input file and creates a plot like the following from the collected data.
All in all, the usage of this library feels much more comfortable, especially when dealing with poorly formatted input data that requires a great amount of preprocessing. Of course, Gnuplot bindings for languages other than Perl do exist as well.